

Have you ever visited a website that enthralled you with its moving pictures and interactive elements? Do you want to create engaging websites that communicate with images, videos, and brilliant colours? If so, D3.js is the ideal tool for you!
So just what is D3.js? Let’s take a closer look at this amazing technology. As the old adage goes, “a picture is worth a thousand words,” and this is where data visualisations come in. Graphic representations have a special effect on our imaginations, bringing seemingly mundane data to life.
The value of charting data was first established by statistician Francis Anscombe in 1973. His ground-breaking study demonstrated how data visualisation through graphs and charts improves our knowledge. Since then, images have grown in importance, with applications in a variety of sectors, including digital content.
There are good data visualisation courses available to assist you master this ability if you’re keen to learn how to get started with D3.js.
What exactly is D3.js?
D3.js is a JavaScript toolkit that allows developers to generate dynamic and interactive data visualisations in web browsers. It makes use of widely used technologies such as SVG, HTML5, and CSS.
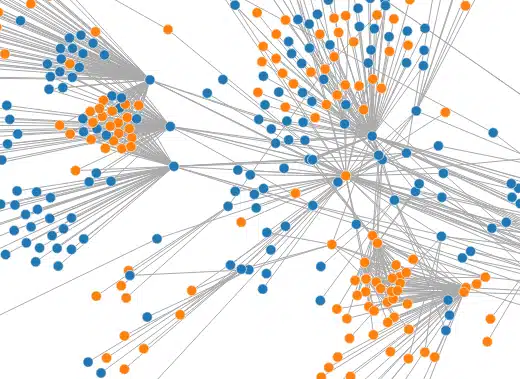
D3.js has been used on millions of websites to create dynamic visuals for online news portals, data-driven information dashboards, and mapping apps that use GIS data.
The requirement for interactivity drove the desire for data-driven papers. Users rapidly become bored with previous websites since they were stagnant and lacked interactivity. This motivated developers, researchers, and engineers to create tools like as Prefuse, Flare, and Protovis, which resulted in the creation of D3.js.
D3.js is inserted in an HTML website and uses pre-built JavaScript methods to select items, generate SVG objects, apply styles, and add transitions, dynamic effects, and tooltips. When you integrate the D3 library into your website, you have the ability to write data in a variety of forms, such as JSON, CSV, or geoJSON. If necessary, JavaScript functions can be built to read different data formats.
What Are the Benefits of Learning D3.js?
There are various benefits to use D3.js, particularly if you want a simple and effective approach to include graphics into your website.
- Examples: The D3.js community is filled with enthusiasts who love sharing their work. Many of these code snippets are freely available, providing a wealth of inspiration and ideas. By exploring these examples, newcomers can gain valuable insights and even attempt to recreate them.
- Good Support: In addition to the original developer community, D3.js has a sizable and helpful community that is eager to share code and help newcomers. You can find a tonne of helpful blog entries, Stack Overflow discussions, and GitHub repositories with just a quick Google search.
- Excellent Opportunities: Adding D3.js to your skill set increases your marketability as a developer. Making interesting and dynamic data visualisations is a skill that is always in demand and may lead to new job chances. Also, D3.js relies on the fundamental understanding of HTML and JavaScript, which are today’s crucial abilities for developers.
- Incredible Features: Compared to competing technologies like Google Charts and FusionCharts, D3.js offers a number of advantages. Instead of selecting from a small number of pre-defined alternatives, D3.js gives you the ability to design unique representations that are particular to your needs. D3.js does not place limitations on the intricacy or scale of your charts or graphs, in contrast to Google Charts. Moreover, it allows for the flexible addition of features like zoom and click capabilities. In addition, compared to other technologies, D3.js makes it simpler to manipulate and update data.
These are just a few of the numerous benefits that D3.js offers. Learning this powerful technology enables you to manipulate your Document Object Model (DOM) effectively and create stunning data visualizations. So, embrace the world of D3.js and unleash your creativity in transforming data into captivating visuals.